TOP 11 COVID-19 STATISTICS MAINSTREAM NEWS IS HIDING FROM YOU
All of this data is extracted from the CDC, WHO, Johns Hopkins, White House task force press conferences, and scientific studies. All direct source links are cited below the list of statistics. A printable pdf version is available at the bottom of this page for those who wish to print and distribute these facts. 90% of Covid-positive individuals are asymptomatic. This is the most significant and meaningful statistic of all. Asymptomatic Covid-positive have a spread rate of only 0.7% – less than 1%. They are NOT super spreaders. Survival rate of ages 0-69 is 99.82%. Survival rate of age 70+ is 94.6% with high comorbidities and other causes of death. Dr. Deborah Birx and state health officials confirmed that all Covid-positive individuals who die from other causes are being counted as a Covid death, including, but not limited to: car accidents, gunshot wounds, 1-week to live in hospice, drowning, dementia,…
COVID-19 Pt. 4: The “Test” That Changed The World is Deeply Flawed
It’s hard to imagine that a single test could change the world so drastically, especially when the test itself is riddled with problems. Scientists are calling for the retraction of the original protocol used in the Covid-19 tests . The New York Times even raised red flags about it, and Dr. Anthony Fauci himself has said that if the cycle threshold is set too high, it will pick up dead nucleotides, which causes false positives. Once people understand that one of the biggest reasons why 90% of those who test positive have no symptoms, is because the tests themselves were not developed with accurate science, the world will be infuriated. These numbers are being used as the pulse of our society, and when deaths from other causes, who test positive for Covid, are being counted in the death toll and lockdowns are being based on this, it is criminal. Part…
My Personal Experience with Covid-19 and Digging Up The Evidence, for Transparency
As an investigative journalist, I have written numerous reports on Covid-19, including information from inside the hospitals, tying together data points, the science, big pharma, funding, therapeutics and vaccines, and the impact it has had on our economy to the detriment of the people. In addition to hundreds of hours of research, analysis, and first-hand observations, I have had personal experiences and connected with many in the medical field. Because I have published so many reports regarding Covid-19, for transparency purposes, I want to share how I have arrived at my conclusions, as well as gathered the evidence to back my reports. Early on, when Covid-19 first hit the U.S., I was already observing false flags, viral video propaganda, and bad actors warning people that 1-2 million people would die. I’ve seen this show before. I’ve observed it, researched it, and in some cases lived through it. They come on…
COVID-19 Pt. 3: Nursing Homes and Long Term Care Facility Deaths “With” OR “From” Covid Facts
It has consistently been reported that nursing homes and long-term care facilities account for 40% of all Covid-related deaths, but how do these numbers actually breakdown? Is the general population aware that they are including these deaths in the total mortality data if they test positive but it’s not the cause of death, as Dr. Deborah Birx from the White House Covid-19 Task Force has stated, and as the CDC disclosed? Hospitalization data has also been distorted and is incredibly misleading, which was covered in part 1 of this report, including the fact that the 2017-2018 flu season far exceeded Covid hospitalizations, and the CDC is grouping pneumonia, influenza, and covid (PIC) for death totals, which was covered in part 2 of this report. Both contain critical data points put out by the CDC and the Covid Tracking Project to understand the real numbers. Perhaps the worst part to all…
COVID-19 Pt. 2: CDC’s New “PIC” and The Hidden Data
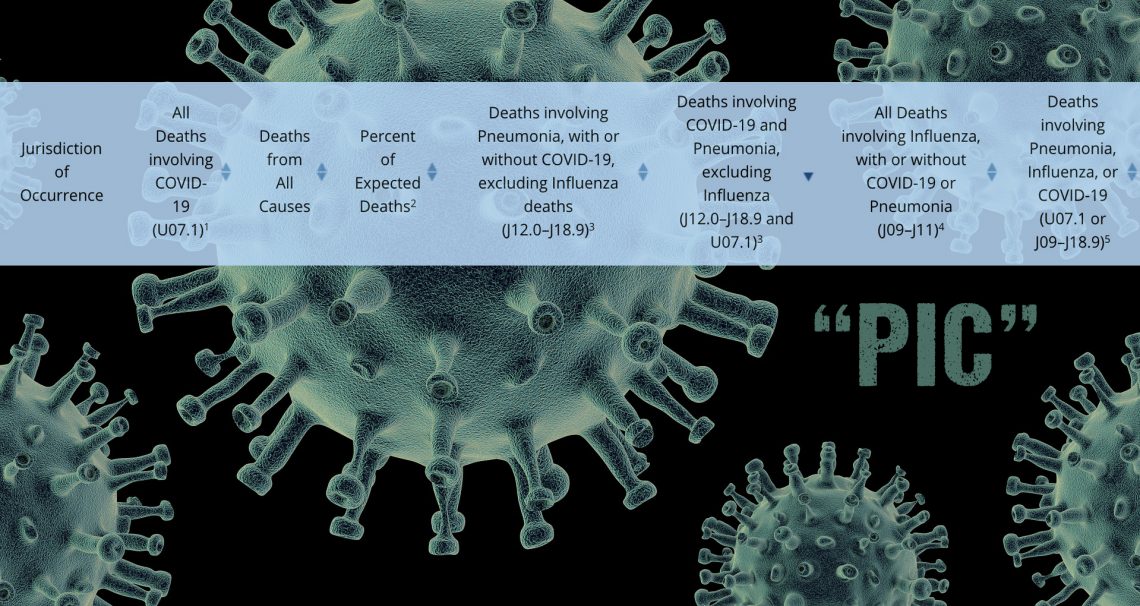
In part 1 of this 5-part report on Covid-19, Corey’s Digs detailed a necessary reality check due to the media creating a frenzy over hospitalizations, despite the fact that the 2017-2018 flu season was hit with 810,000 hospitalizations, far more than Covid, and no one heard a peep about it. There were no lockdowns, restrictions, hyperbole, or mandatory masks, and 61,000 people died that season. Most people aren’t aware that the CDC has lumped influenza together with Covid and pneumonia in death rates with a new name called “PIC.” This comes after the CDC confirmed that only 6% of Covid-related death certificates indicate Covid as the only cause, while 94% list other illnesses as the cause with an average of 2.6 comorbidities. In other words, if someone was in the hospital dying of heart disease and they tested everyone for Covid to separate them to other rooms or wings, Covid…


