


CDC Bases Covid Jab Death Toll % on Doses – Not People, as Death Toll Topples all Other “Vaccines” for 3 Decades
For over 18 months Corey’s Digs has been reporting on the CDC’s inconsistencies, manipulated numbers, falsehoods, and blatant lies. Not only did the CDC bury influenza deaths under the guise of Covid, they also lumped pneumonia deaths with Covid, in addition to documenting anyone who died WITH Covid who was in a car accident, had a gunshot wound, kidney failure, or other life-threatening diseases, as a Covid death. Now, they are basing the percentage of jab-related Covid deaths on the number of doses administered rather than the number of people who received the jabs – an incredible mathematical error, surely done with intention.
In this article, it exposes how the CDC is once again manipulating minds by manipulating death toll numbers from the Covid jab. It also shows discrepancies in efficacy, and an alarming chart comparison to other jabs with reported deaths over the past three decades, which should raise a red flag for everyone.
Most people are fully aware that the CDC’s VAERS reporting system has lacked in reporting over the years, so it’s fairly safe to say that the death toll after receiving a Covid jab is under-documented to begin with. Furthermore, the CDC and HHS went above and beyond to document all death certificates into their database to escalate the number of people who died WITH Covid, not FROM Covid. Yet, they don’t seem to be documenting death certificates of those who died after receiving the Covid jab. The only “reporting” seems to be running through their VAERS system.
That said, here is a perfect and yet very simple example of how the CDC manipulates numbers directly on their website, assuming that the average person isn’t going to bother to do the math. The mainstream news, whose so-called journalists also won’t do the math, then take the information and spin it out to meet their narrative, much in the way they recently did with the FDA’s bait-and-switch on the Pfizer Covid jab’s so-called approval.
CDC Intentionally Decreases the Overall Percentage of Reported Deaths After Receiving Covid Jab
The CDC reported that the death toll on the VAERS reporting system indicates 6,968 deaths as of August 18, 2021. Next to the death toll they point out that the 6,968 deaths amount to (0.0019%) “among people who received a Covid-19 vaccine.” This is a totally false statement. They are basing it on the number of jabs administered, when most people have already received BOTH jabs. They indicate that 363 million doses have been administered. The population of the U.S. is only 328.2 million, therefore millions of people have received two doses. They are using the 363 million “doses” to establish the 0.0019%, which is NOT “among people,” but rather “doses,” and ultimately reduces the percentage by nearly half. This is done for perception, because percentages have a greater impact on a person’s mind.
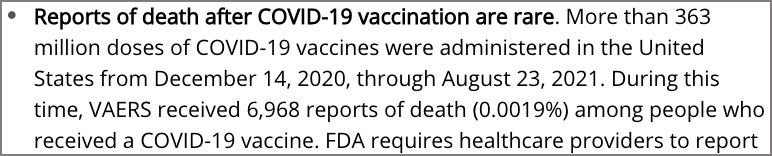
Note that they state “reports of death after Covid-19 vaccination are rare.” Yes, perhaps the “reports” are rare because many are not even being reported, but the alarming death toll itself is even rarer, and they are downplaying it.
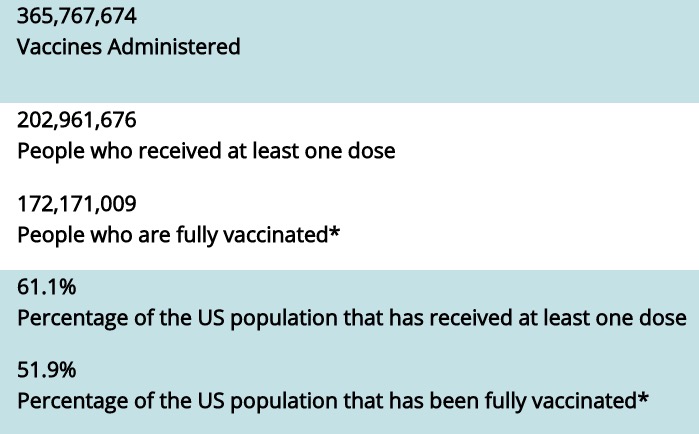
On a separate CDC page from the last week of August (it’s updated weekly), one can find the overall breakdown of how many people have received the jab, whether it be one dose or two. This is a critical number that plays into their incorrect math. A total of 203 million PEOPLE have received the jab, which is a considerably lower number than 363 million DOSES.
Let’s break this down based from actual CDC numbers:
1) 363 million doses administered (based on the CDC’s first link that stated deaths at 0.0019%)
2) 203 million people, or 61.1% of the population have received at least one dose
3) 172.2 million people, or 51.9% of the population have been fully vaccinated
4) 328.2 million people is the total population of the U.S.
5) 6,986 deaths after Covid jab as of August 18th – allegedly amounting to 0.0019% of people who received the jab.
Here’s the simple math:
203 million PEOPLE received at least one dose
6,986 PEOPLE died after receiving the jab (The percentage should be based on the number of PEOPLE who died who received a dose of the jab. It’s irrelevant whether they received one or two doses. A person could get 10 jabs and if they don’t die, are they going to say 10 people survived, or just one person survived all 10 jabs? Exactly.)
203 million PEOPLE x 0.0019% only accounts for 3,857 deaths
363 million DOSES x 0.0019% accounts for 6,897 deaths – THIS is how they arrived at their false percentage
If the CDC had done the math based on “people who received the vaccine” as they claimed, and as would be correct, that math would look like this:
The total number of deaths from 203 million PEOPLE who received the jab (6,986) = 0.0034%
The actual percentage of people that died after receiving the Covid jab is 0.0034%, not 0.0019%.
By doing that, they nearly cut their percentage in half. This may seem like a minimal percentage difference, but in terms of people who have died, that’s a difference of 3,040 people. They are basing deaths on doses rather than people receiving the doses, which makes a considerable difference, and is typical CDC trickery because they know how percentages impact the mind. This is how the CDC and mainstream news have manipulated numbers and minds since Covid hit the U.S. They refer to the CDC as the “experts” but the only thing they are experts at is manipulating numbers.
The task force and health department officials have all stated they are including anyone who dies from a heart attack, stroke, car accident, gunshot wound, kidney failure, or any other cause of death, as a “Covid death” IF they test positive with Covid pre or postmortem. Unfortunately, all most people here is that over half a million Americans have died FROM this virus. Imagine how the above percentages would drastically change, if the real numbers were published.
The CDC Can’t Reconcile Their Efficacy Claim
Perhaps the most telling of all, is the CDC’s claim on how effective the Covid jabs are. Aside from the aforementioned survival rate of 99.98% remaining strong for a year, without any increase after 203 million people have received the jab, this next point only adds to their disinformation.
On August 19, 2021, the CDC alleged that the Pfizer BioNTech jab was 95% effective at preventing the Covid virus in clinical trials, and that the mRNA jabs are 90% effective in the real world. And yet, in July, just one month prior, the CDC published a study showing that 74% of fully vaccinated people against Covid, who were in an infected area of Massachusetts, tested positive for Covid. How do they reconcile that discrepancy? Here’s how: they are willing to take the hit on the false efficacy so they could inflate the fear around the alleged Delta variant to get more people to take the jab, while also blaming a “new variant” on the fact that the jabs don’t really prevent anyone from getting sick, and at the same time, allowed them to resurrect the mask mandates. A clever, not-so-clever little bunch of manipulators. Multiple mainstream news sources covered this, which is even more telling that this was their goal.
In pulling this stunt, they pulled the same trickery with the numbers. They stated that there were 469 people who tested positive for Covid, and that 74% were fully vaccinated. That would mean that 348 people had been fully vaccinated, and 121 were not. Since they had already established that 469 people tested positive for Covid, one would think they would be able to differentiate how many of those were the alleged Delta variant, but instead, they only mention that of “133 patients, 90% of specimens were the Delta variant,” which coincidently equals 120 people. They are trying to implant suggestive reasoning in people’s minds that therefore 90% of all 469 people likely had the alleged Delta variant, when in fact it is far more likely that the alleged Delta variant is non-existent, and the Covid jabs have no efficacy rate to a virus that was never isolated, and has over a 99.98% survival rate based on highly exaggerated case numbers by the CDC. This also establishes plausible deniability for the future, should they want to make the claim that the alleged Delta variant only affected those who hadn’t received the jab yet, in case too many people stopped getting the jab for fear it wouldn’t work on the Delta variant.
The study also found that fully vaccinated people who do get infected, carry just as much of the virus in their nose as unvaccinated people. Pfizer’s fact sheet states “the duration of protection is currently unknown,” as do the other jab fact sheets. More plausible deniability to keep this scheme rolling.
A little over a year ago, many of us predicted that the jabs may cause people to get sick and possibly die, and wouldn’t necessarily prevent them from testing positive for Covid, especially since the tests are also faulty.
This entire plandemic is teetering on a falsehood that is so grand, it’s almost difficult keeping tally of all the lies rolled out to subdue people into getting the jab so the globalists could roll out their true master plan – the digital identity to get everyone on a QR code that will link to the Blockchain, hosting all data on each individual on a global scale to be surveilled and controlled.
Covid Jab Death Toll Topples all Other Vaccines While CDC Claims The Covid Jabs Are “Safe and Effective”
The Covid-19 jab isn’t the only jab that has potentially resulted in death. That said, let’s take a look at the comparison.
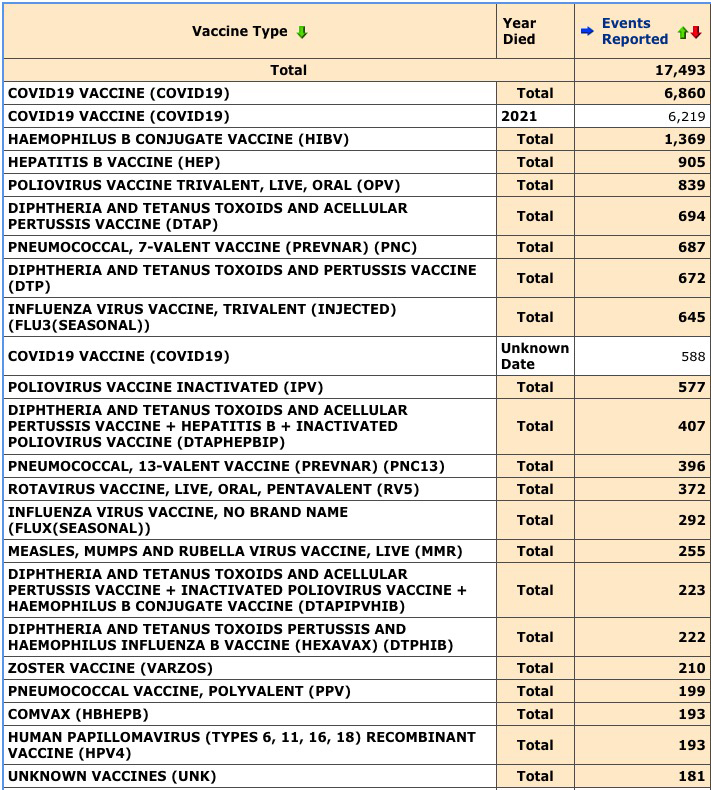
What is the first thing one might observe in the chart below? The fact that the Covid jabs have only been administered for 8 months, and nearly 7,000 deaths after receiving the jab have been reported to VAERS, versus many of these other vaccines that have been administered for decades, is a huge red flag, yet the CDC, HHS, NIH, politicians, and failed legacy media all continue to purport it as “safe and effective,” and “death is rare.” What constitutes as being “rare”? Is it “rare” that nearly (and likely far more) 7,000 deaths have resulted after receiving the jab? Is it “rare” that the FDA hasn’t put a halt to these jabs based on this astronomical number? It’s shocking, to say the least.
To put this in perspective, the CDC states that for the 2021-2022 flu season, there will be 188 to 200 million flu vaccines for the U.S. market. This chart below goes back to the early 1990s. Parents are ordered to get their children vaccinated with multiple vaccines for school. Those too are on this list. Therefore, the fact that there has been a large number of Covid jabs administered in such a short time, is still far less than the cumulative of many of these other vaccines listed in this chart, making it even more alarming.
This screenshot only reflects the top 22 rows. It goes on for quite awhile, but is in descending order with the highest deaths reported at the top. It includes all jabs to date and deaths reported after receiving those jabs, though reporting has always been low, so all numbers are likely higher. How can anyone, especially the FDA and CDC, look at these numbers and declare it as justifiable?
And while they continue to push the jabs as “safe and effective,” Pfizer and Merck are already working on antiviral pills that must be taken twice a day in conjunction with the jabs, and Pfizer is so confident theirs will be approved, they are already producing them before the clinical trials are finalized. Apparently “both drugs use technology that blocks the ability of a virus to replicate and spread further throughout the body.” And on another front, Gavi is raving about the “holy grail” of vaccines that will be a single vaccine to defeat all variants of coronavirus, with the hopes of producing it within a year’s time.
Word of Advice
Always do the math, and always follow the money trail. The CDC and the legacy media have been lying on numbers and percentages since this began in early 2020, and much longer in other cases. Corey’s Digs did a 5-part report that lays out many of these discrepancies, as well as how they use fear to manipulate the masses. Their percentages are almost always based off of an incorrect group for the equation at hand, or they stuff and bury numbers making it impossible to extrapolate the true numbers.
This isn’t just with Covid – this is a common trick they’ve been playing for years. They did this with the alleged 2019 measles outbreak as well, which was a precursor to test the waters on mandating vaccines in neighborhoods and colleges. After digging through 26 years of CDC documents, Corey’s Digs was able to establish their false reporting on the measles death rate that the CDC, WHO, and mainstream media had been inflating as a scare tactic. They all repeatedly reported 0.1% – 0.2% measles death rate based on measles cases in the U.S., when in fact it is only 0.07%. This may seem minimal, but that’s a difference of 4 deaths versus 12 deaths in 26 years, while they terrorized people with stock photos of a baby allegedly covered in measles, warning people how deadly it could be for babies. Four deaths in 26 years who died WITH the measles, while the government was paying out on 483 injury and death claims from the MMR vaccine (measles, mumps, and rubella). There have been 255 MMR vaccine-related deaths reported, as seen in the chart above. To recap, that’s only 4 measles-related deaths, with 255 MMR vaccine-related deaths reported, for a vaccine to “prevent death from measles.” Reconcile that.
This is a multi-trillion-dollar industry and the only thing standing between their bank account and the jab, is us. They will exaggerate, manipulate, and flat out lie to terrorize people into believing they are going to die and that their bodies are incapable of healing themselves with proper care or therapeutics they refuse to make easily accessible. How many more people are willing to take these odds for a false sense of peace of mind? In fact, pick up the phone and call Pfizer’s customer service at 800-879-3477 and listen to the 7 minute message about side effects, in which they fail to mention death. They also state that both of their “vaccines” are the SAME formulation but one is only emergency use authorized, while the other is FDA approved, yet they can be used interchangeably. This is all explained in the recent article on Corey’s Digs about the FDA’s bait-and-switch.
Perhaps pointing these incredible mathematical discrepancies out is all for not – or perhaps it’s just what the doctor ordered for some people to spot the trickery and evolve out of the destructive spell they’ve been under. Even if this information only helps one person, it was worth it. They can take that to the bank!

Subscribe to Corey’s Digs so you don’t miss a Dig!
Corey Lynn
Corey Lynn is an investigative journalist, co-host of the weekly Dig It! podcast, and co-host of The Solution Series. Follow her at coreysdigs.com, on Twitter, Gab, Truth, Rumble, and Telegram. Support her work by becoming a Patron, making a donation or buying a Book.


27 Comments
feduptickedoff
the old adage – I believe it goes something like
statistics lie and liars use statistics
Nikki
Yo CoreyLyn
We have big problems.
Check this out.
The truth bombs and synchronicity that has been happening to me my whole life and but more so recently.
I reckon you will wanna really SEE/watch this they’re trying to take them down I heard.
I haven’t been able to look away.
https://www.cosmicnews.org/2021/09/03/lost-history-of-flat-earth-ewar/
God help us I pray Amen.
Namaste, stay safe
Nikki
Steve B
And they don’t count anyone who died until 14 days afer their second jab. You could die 2 minutes after the jab and it’s not considered a vaxxx death.
Michael James
There are three types of lies. Lies , damn lies , and Statistics….
Mark Twain.
Joel Walbert
While I have not seen documented proof of this, it is also alleged that in order to boost case numbers (not to be confused with actual illness from whatever they label CovAIDS at the moment) if the same person gets a positive and then another positive upon re-testing, that is counted as two positives. In other words, per test, not per person.
Jed
Something that needs more research and clarification is the effect of counting people as vaccinated only when 2 weeks have passed after they receive the injection. If someone gets a shot and becomes ill with or without testing positive for the virus before the 2 weeks have passed are they being counted as an unvaccinated person developing a case of illness? While the public is told that most serious cases are in the unvaccinated, what percentage of those “unvaccinated” are actually people who very recently received vaccines and became ill right after receiving the shot, before the 2 week timeframe of the vaccine taking full effect has passed? To properly track things a category of “recently injected” to cover that 2 week window would need to be added since those people are not free of the injections and not at the stage of having the hypthetical full benefit of the shot. Perhaps that time window is a time of great risk for people to become ill, which can be recognized as a hazard of the shots or spun with misleading statistics to increase the perception that unvaccinated people are highly at risk.
FreeSociety
The VAERS Database reports that over 13,900+ people have DIED from the Covid Injections, not merely 6800 people.
So I don’t know where the CDC gets off just ignoring over half of the reported death events from the VAERS Database.
You can track the statistics easily from: https://www.openvaers.com/
Jasonn
I think it would be useful to publish which vaccine the “fully vaccinated victims had received before catching COVID so we can observe if there is a pattern. Why don’t you do that?
David Francomano
Great work as usual Corey! Thank you.
DoTheMath
VAERS is intended up to accept reports of adverse events after a vaccine (shot) is administered. It’s not about adverse events after being fully vaccinated. Therefore, each dose (shot) represents a unique opportunity for an adverse event. Some people might have an adverse event after the first dose, some people might have an adverse event after the second dose, and some people might not have an adverse event after either dose.
Whether you like the vaccine or not, dividing the total number of doses by the total number of adverse events is proper.
DoTheMath
“The VAERS Database reports that over 13,900+ people have DIED from the Covid Injections…”
I’m sorry but the VAERS database does not say that.
Gary Lee Andresen
Corey, congratulation on your excellent work.
This subject is dear to me as I do my best to get the truth out about COVID, the so-called vaccines, and other subjects.
This will be included in today’s update of my article list and will be shown on BOLD letters for September 6th.
https://wp.me/p5Vyf0-85P
Gary Lee Andresen
Corey, sorry that link may not work when I finish my updates, so this should be used to see the finished product later today or the bottom one for yesterday’s article update.
https://fatherlyadviceandrants.com/2021/09/07/september-2021-conservative-article-reference-list/
https://fatherlyadviceandrants.com/2021/09/06/september-2021-conservative-article-reference-list/
mjc227
Multiply the number of deaths on the VAERS site by about 20 to get a much closer number of the real death toll from the globalist kill shot. VAERS is a voluntary reporting site. Many doctors are just going along with the CDC propaganda when they should know better.
Adon
I also have read that each positive covid test is considered a Case of Covid, including many multiple tests from one individual !
Mitch Black
Nobody is perfect, but this is way beyond reconciliation. Fauci and his ilk require charges brought against them and try their luck with the justice system. These people make Hitler look like Peter Pan. I forwarded this out to many on my address list. Especially to those who will forward it out to others, and those who are still in denial. We never know what it takes to break the entrainment. We just have to believe it will make a difference no matter what. Recoiling and giving up is not an option. Keep up the great work!
P.S. I have been preaching the numbers issue on much of this for months. Some people have to see the numbers and then they got it.
Private School Superintendent
I think the CDC deception has to do with the next target in their sights-school age vaccinations. If you mine the CDC data to calculate the % chance of a 5-17 year old of dying if they get COVID you will find it is about the same chance as dying from getting vaccinated…. so why risk the vaccination?
Seems like only aged politicians and healthcare workers are making self-serving decisions during this “pandemic.” No one seems to be looking out for our youth and our (their) future.
Jasper Signa
Corey, You should also check out this data set from the CDC. In the weekly provisional counts of deaths 2020-2021 there is a huge statistical abnormally in deaths from “Symptoms, signs and abnormal clinical and laboratory findings, not elsewhere classified R00-R99”
Since 2014-2020 this has averaged about 630 deaths a week across the US but since the covid jab has been consistently over 1000 and peaked as high as 3,400. Also the number of deaths from this category is highly coorelated with the number of fully vaccinated individuals 0.93. I think this is potentially what is being recorded on people’s death certificates and might provide insights to the true numbers not reported in VAERS. My rough estimate ~35k based on deviation from historical norms. Hope you or someone in the know can check this out.
https://data.cdc.gov/NCHS/Weekly-Provisional-Counts-of-Deaths-by-State-and-S/muzy-jte6
Arnold Ziffel
HHS has done a poor job of administrating VAERS data, and some of the data has errors, omissions, and anomalies. HHS never created a proper category for comorbidities, and instead, users put in narratives that can’t be data mined and categorized. Also, it did not include race.
Nonetheless, we can make inferences. The big takeaway is the average age of death from the vaccines is 73 years of age. The average age of hospitalizations is 50, which is no doubt caused by morbid obesity and comorbidities. Also, complications are spread equally between the pharmaceutical companies.
IainW
The data on incidents is under reported – possibly only 1% of all deaths. Apparently a Pfizer whisle blower has data (not yet released) that shows the deaths associated with that jab. The indication is the figure is large. Be interested if it surfaces.
Kimmy Jo
My employer has emailed us that the vaccine is now mandatory. I guess I was dillutional to think it would not affect me but here I am. I will not be taking the jab and not quitting.
Any updated documentation that can be used since the pretender in chief’s edict?
investigatethefacts
There is video showing deaths on Vaers and case number being replaced as a person with a reaction but not dead yet. If only 3% of the deaths are on the vaers site…well you do the math…I have zero associates dead of covid and one elderly client dead from 4 things not covid but end of life pnuemonia was called covid. I have currently 7 associates and friends DEAD post jab.
Mary
I recently read that a child is 6 x more likely to get a heart condition after the shot then to be hospitalized after contracting the virus.
Deanna Johnston Clark
I’m very thankful for this site and those standing up to this mandate. The Jewish section in the Liberty recommendations for religious exemption is very mpving to read and impressive.
Sus
According to VEARS till September 03, 2021 there were 14.506 deaths from COVID-vaccines.
Very impressive chart: https://openvaers.com/covid-data/mortality
In Europe we have even way more official deaths with 24.526 according to EudraVigalance (till Sept.11, 2021).
The numbers are rising weekly!
And you cant count the deaths just in percentages!
And @ JED:
It’s absolutly true! Everybody, who goes to hospital bevor the 14 days after the second shot, they ‘count’ as unvaccinated! I don’t know, if those, who obviously die within hours after the jab, get counted by VAERS.
–>>–>> https://thecovidblog.com/category/vaccine-deaths/
In Germany docters got coerced, when they truely wrote in the official documents, that a patient died because of ‘unnatural reasons’ after the vaccine. A doctor had to change the reason of death into ‘natural’ death, after being threatend by the police, just in case, she wants to continue working as a doctor…, so we just can assume, that many jab-deaths keep unreported.
Also my 80-year old vaccinated aunt died 10 days ago because she had ‘not enough blood’… and nobody will ever yount her as a victime of the COVID vaccine. She had polio (related to Rockefeller DDT-poisening) and her live was ruined by the same guys, she tragicly trusted in the end…
Deborah
I think I’m seeing the same with CDCs EXCESS DEATH data. As usual, the numbers don’t seem to add up! Many times, deaths are lower in 2020/2021 than previous years. The chart should say “From Select Causes”, not “All Causes”.
First let’s look at why there was an increase in 2017/2018- far left side of graph.
https://www.cdc.gov/nchs/nvss/vsrr/covid19/excess_deaths.htm
2018 – RE: EXCESS DEATHS…
30Dec17: 59,473 6.5% excess
6Jan18: 60,265 13.9%
13Jan18: 60,687 15.3%
20Jan18: 61,083 9.8%
27Jan18: 61,312 6.2%
3Feb18: 60,952 3.7%
10Feb18: 60,733 4.4%
17Feb18: 60,606 2.3%
24Feb18: 60,136 0.0%
FLASHBACK 2018- 2017/2018 was the worst Flu season in decades. Sound familiar?
HOSPITALS OVERWHELMED BY FLU PATIENTS, ARE TREATING THEM IN TENTS
The 2017-2018 influenza epidemic is SENDING PEOPLE TO HOSPITALS AND URGENT-CARE CENTERS IN EVERY STATE, and medical centers are responding with extraordinary measures: ASKING STAFF TO WORK OVERTIME, SETTING UP TRIAGE TENTS, RESTRICTING FRIENDS AND FAMILY VISITS AND CANCELING ELECTIVE SURGERIES, to name a few.
“Almost every patient in the hospital has the flu, and it’s making their pre-existing conditions worse,” she says. “More and more patients are NEEDING MECHANICAL VENTILATION DUE TO RESPIRATORY FAILURE FROM THE FLU AND OTHER RAMPANT UPPER RESPIRATORY INFECTIONS.”
https://time.com/5107984/hospitals-handling-burden-flu-patients/?fbclid=IwAR3wNyKo2yayfSUAjiA0LZuYpBZ-4blMMvF1GgI2GbRlhT3zQCYqs4ReCzg
CDC: 45 MILLION cases, 21 MILLION doctor visits, 810,000 hospitalizations
— severe for all US populations and resulted in an estimated 959,000 hospitalizations and 61,099 deaths
–GUESS WHICH STATES WERE HIT HARDEST? NEW YORK, CALIFORNIA, WASHINGTON STATE, DELAWARE, MINNESOTA.
–The flu season was exacerbated by a shortage of IV bags caused by IV bag plant closures in Puerto Rico following Hurricane María.[5] The CDC estimates that 61,000 AMERICANS DIED DUE TO INFLUENZA DURING THE 2017-18 FLU SEASON.[6]
— On 10 February 2018, Bloomberg reported that INFLUENZA IN THE UNITED STATES WAS KILLING UP TO 4,000 AMERICANS A WEEK.
— In the first week of February, deaths from influenza and pneumonia were responsible for ONE OF EVERY TEN DEATHS IN THE US.
>>>>2020 NO SHOTS- DEATHS/WEEK & % EXCESS – COMPARED TO PREVIOUS 2 YEARS<<<<
—-Red Cross/CDC Blood sample indicate CV was circulating from 13Dec19. Notice that the number of deaths remain consistent, with normal increases per year throughout. All data is from the graph at the link.
WEEK ENDING
28Dec19: 63,111 0% excess (2018: 61,687 0%. 2017: 59,473 6.5%)
4Jan20: 63,820 0% (2019: 62,333 0%. 2018: 60,265 13.9%)
11Jan20: 64,230 0% (2019: 62,789 0%. 2018: 60,687 15.3%)
18Jan20: 64,601 0% (2019: 63,163 0%. 2018: 61,083 9.8%)
25Jan20: 64,535 0% (2019: 63,380 0%. 2018: 61,312 6.2%)
1Feb20: 64,399 0% (2019: 63,161 0%. 2018: 60,952 3.7%)
8Feb20: 63,907 0% (2019: 62,715 0%. 2018: 60,733 4.4%)
15Feb20: 63,708 0% (2019: 62,708 0%. 2018: 60,606 2.3%)
22Feb20: 63,317 0% (2019: 62,464 0%. 2018: 60,136 0%)
29Feb20: 62,862 0% (2019: 62,047 0%. 2018: 59,804 0%)
—–29Feb20 FIRST REPORTED COVID DEATH
7Mar20: 62,437 0% (2019: 61,576 0%. 2018: 59,212 0%)
14Mar20: 61,752 0% (2019: 61,752 0%. 2018: 58,776 0%)
21Mar20: 61,324 0% (2019: 60,830 0%. 2018: 58,517 0%)
—–383 CV DEATHS- avg 128/week. 494 more than same wk in 2019. 2,807 more than 2018.
—–EXCESS DEATH % BEGINS IN CHART
28Mar20: 60,906 7.3% (2019: 60,259 0%. 2018: 57,850 0%)
—–2,836 CV DEATHS- avg 709/week. 647 more than 2019. 3,056 more than 2018.
4Apr20: 60,285 24.4% (2019: 59,556 0%. 2018: 57,850 0%)
11Apr20: 59,627 37.3% (2019: 58,997 0%. 2018: 57,189 o.2%)
—–24,755 CV DEATHS- avg 4,126/week. 630 more than 2019. 2,438 more than 2018.
9May20: 57,293 21% (2019: 56,829 0%. 2018: 55,344 o.9%)
25Jul20: 54,626 21.6% (2019: 54,509 0%. 2018: 52,913 0%)
—–153,048 CV DEATHS- avg 7,288/week. 117 more than 2019. 1,713 more than 2018.
1Aug20: 54,523 21.9% (2019: 54,420 0%. 2018: 52,769 0%)
10Oct20: 55,832 14.5% (2019: 56,729 0%. 2018: 55,111 0%)
—–223,734 CV DEATHS- avg 6,992/week. 897 LESS than 2019. 721 more than 2018.
7Nov20: 56,987 22.6% (2019: 58,466 0%. 2018: 56,646 0%)
—–248,722 CV DEATHS- avg 6,909/week. 1,479 LESS than 2019. 341 more than 2018.
12Dec20: 59,388 42.6% (2019: 61,590* 0%. 2018: 58,999 0%)
—–317,307 CV DEATHS- avg 7,739/week. 2,202 LESS than 2019. 389 more than 2018.
—–15Dec20 VAX PROGRAM BEGAN
2Jan21: 61,936 45.3% (2020: 63,820* 0%. 2019: 62,333* 0%. 2018: 60,265 13.9%)
—–374,942 CV DEATHS- avg 8,521/week. 1,884 LESS than 2020. 397 LESS than 2019.
6Feb21: 63,177 24.7% (2020: 63,907 0%. 2019: 62,715* 0%. 2018: 60,733 4.4%)
—–490,858 CV DEATHS- avg 10,018/week. 730 LESS than 2020. 462 more than 2019.
20Mar21: 61,302 1.4% (2020: 61,324* 0%. 2019: 60,830* 0%. 2018: 58,517 0%)
—–Only 472 more than 2019.
3Apr21: 60,341 o.2% (2020: 60,285* 24.4%. 2019: 59,556* 0%. 2018: 57,850 0%)
—–576,694 CV DEATHS- avg 10,117/week. 56 more than 2020. 785 more than 2019.
—–12May21 VAX CAMPAIGN FOR 12-17s
—–6mo INTO ADULT VAX PROGRAM
19Jun21: 55,553 6.3% (2020: 55,278 8.5%. 2019: 55,276* 0%. 2018: 53,262 0%)
17Jul21: 55,191 6% (2020: 54,858 19.4%. 2019: 54,648* 0%. 2018: 53,015 o.3%)
—–628,990 CV DEATHS- avg 8,736/week. 333 more than 2020. 543 more than 2019.
31July21: 55,052 12.4% (2020: 54,626 21.6%. 2019: 54,509* 0%. 2018: 52,749 0%)
14Aug21: 54,904 24.1% (2020: 54,316 21.3%. 2019: 54,515* 0%. 2018: 52,870 0%)
—–Only 389 more than 2019.
11Sep21: 55,362 34.7% (2020: 54,791 12.8%. 2019: 55,272* 0%. 2018: 53,546 0%)
—–688,573 CV DEATHS- avg 8,607/week. 571 more than 2020. 90 more than 2019.
9Oct21: 56,732 22.4% (2020: 55,832 14.6%. 2019: 56,729* 0%. 2018: 55,111 0%)
—–Only 3 more than 2019!
—–6mo INTO 12-17s VAX PROGRAM, 11mo INTO ADULT PROGRAM
6Nov21: 58,015 0% (2020: 56,987* 22.6%. 2019: 58,466* 0%. 2018: 56,646 0%)
—–779,314 CV DEATHS- avg 8,855/week. 1,028 more than 2020. 451 LESS than 2019.
Deborah
I also looked at all the ICD-10 Codes they used in the Algorithm to determine excess deaths. Most were expected, but I couldn’t find U04.
U codes are under Accidental/Intentional deaths in Mortality data.
U01-U02 is Homicide.
U03 is Suicide.
I finally found it here. For “New Diseases of UNCERTAIN ETIOLOGY”
WHO: ICD-10 VERSION: 2019
International Statistical Classification of Diseases and Related Health Problems 10th Revision (ICD-10)-WHO Version for; 2019-covid-expanded
CODES U00-U49 are to be used by WHO for the provisional assignment of NEW DISEASES OF UNCERTAIN ETIOLOGY. In emergency situations codes are not always accessible in electronic systems. The specification of category U07 in the way it is done here will make sure this category and the subcategories are available in every electronic system at any time and that they can be used upon instruction by WHO, immediately.
https://icd.who.int/browse10/2019/en#/U07
U00-U49
U04 SARS
U04.9 SARS, Unspecified
U06 formerly ZIKA. As of 2019 reclassified to A92.5
U07 Emergency use of U07
U07.0 Vaping & E-Cigarette related Disorder
U07.1 Covid-19, virus identified (WHO: 31Jan20)
U07.2 Covid-19, virus NOT identified (Mar2020)
U08 Personal History of Covid-19
U08.9 Person History of CV19, unspecified
—To record an earlier episode of CV19, confirmed/probable that influences health status. Not to be used for primary mortality tabulation.
U09 Post CV19 condition
U09.9 Post CV19 condition, unspecified (1Oct21)
—Not to be used in cases that stilll are presenting CV19.
U10 Multisystem Inflammatory Syndrome assoc with CV19
U10.9 MIS, unspecified
—Ex: Cytokine storm, Kawasaki-like syndrome, MIS-C, Paediatric Inflammatory Multisystem Sydrome (PIMS)
U11 Need for Immunization agaisnt CV19
U11.9 “ “, unspecified
— This optional code is intended to be used when a person who may or may not be sick encounters health services for the specific purpose of receiving a COVID-19 vaccine. Excl: immunization not carried out (Z28)
U12 CV19 Vaccines Causing Adverse Effects in Therapeutic Use
U12.9 “ “, unspecified (WHO: AEs from CV vaccines1Oct21)
—An external cause code (i.e. as a sub category under Y59, “Other and unspecified vaccines and biological substances””). In addition to this, a code from another chapter of the classification should be used indicating the nature of the adverse effect.
U13 – U49 Reserved for EMERGENCY USE assignments
U82-U85
These categories should never be used in primary coding. The codes are provided for use as supplementary or additional codes when it is desired to identify the resistance, non-responsiveness and refractive properties of a condition to antimicrobials and antineoplastic drugs.
Use additional code (B95-B98), if desired, to identify agents resistant to betalactam antibiotic treatment.
U82 Resistance to BETALACTAM ANTIBODIES
U82.0 Resistance to PENICILLIN
—Amoxicillin, Ampicillin
U82.1 Resistance to METHICILLIN
—Cloxacillin, Flucloxacillin, Oxacillin
U82.2 EXTENDED SPECTRUM BETALACTAMASE (ESBL) resistance
U82.8 Resistance to OTHER BETALACTAM ANTIBIOTICS
U82.9 Resistance to betalactam antibiotics, unspecified
U83 Resistance to OTHER ANTIBIOTICS
—Use additional code (B95-B98), if desired, to identify agents resistant to other antibiotic treatment
U83.0 Resistance to VANCOMYCIN
U83.1 Resistance to other VANCOMYCIN RELATED ANTIBIOTICS
U83.2 Resistance to QUINOLONES
U83.7 Resistance to MULTIPLE ANTIBIOTICS
U83.8 Resistance to OTHER SINGLE SPECIFIED ANTIBIOTIC
U83.9 Resistance to UNSPECIFIED ANTIBIOTIC
—Resistance to ANTIBIOTICS NOS
U84 Resistance to OTHER ANTIMICROBIAL DRUGS
Use additional code (B95-B98), if desired, to identify agents resistant to other antibiotic treatment.
Excl.: Resistance to antibiotics (U82-U83)
U84.0 Resistance to ANTIPARASITIC DRUG(S)
—Resistance to quinine and related compounds
U84.1 Resistance to ANTIFUNGAL DRUG(S)
U84.2 Resistance to ANTIVIRAL DRUG(S)
U84.3 Resistance to TUBERCULOSTATIC DRUG(S)
U84.7 Resistance to MULTIPLE ANTIMICROBIAL DRUGS
—Excl.: Resistance to multiple antibiotics only (U83.7)
U84.8 Resistance to OTHER SPECIFIED ANTIMICROBIAL DRUG
U84.9 Resistance to UNSPECIFIED ANTIMICROBIAL DRUGS
—Drug resistance NOS
U85 Resistance to ANTINEOPLASTIC drugs
—Incl.: Non-responsiveness to antineoplastic drugs, Refractory cancer
https://icd.who.int/browse10/2019/en#/U82-U85